
By David Keith with huge help from Daniel Thorpe
How a physics breakthrough that enables huge energy savings may bite back when it meets the locavore
N.B. The impatient may skip to the policy section, "Jevon's salad" below.

Being an energy nerd I got to thinking: what’s the energy and carbon cost of this lettuce compared to store-bought? And, can I illustrate the lessons we aim to teach in our upcoming online course, Energy Within Environmental Constraints?
And also, what lessons can I draw about the links between energy efficiency and demand? The garden is enabled by super-efficient LED lighting, but is that efficiency reducing or increasing energy use?
First, a dive into the specifics, then on to Jevons’ ‘paradox’.
We bought an Aerogarden for $280: a complete system with 45W of LED lights in a specific mix of colors that helps drive plant growth, plus a computer-controlled irrigation pump.
The grow lights are on 16 hours a day and the yield is about 20 g of lettuce (a small serving) every three days. What’s the energy and carbon intensity?
- Input: 45 W × 16 hr/day × 3 days = 2.2 kWh of electricity
- Output: 20 g of lettuce
- Energy Intensity: 110 kWh/kg (electricity)
This is the input of electrical energy, but we don’t mine electricity. So we need to compute the amount of primary energy needed to generate the electricity, which is approximately 3 times as much [i]. This brings our total to 330 kWh = 1.2 GJ = 1,200 MJ of primary energy required to produce 1 kg of lettuce. That’s a big number. The energy content wood is about 15-20 MJ/kg.
It’s no easy task to estimate the lifecycle energy inputs into traditionally-grown lettuce, including energy to plant seeds, water and fertilize, harvest, and transport over large distances, but a variety of academic estimates have converged on a range of 4 to 14 MJ of primary energy per kilogram of lettuce, two orders of magnitude lower than our supremely local greens [ii]. Lettuce grown in heated greenhouses at northern latitudes has much higher lifecycle energy cost than field lettuce, around 200 MJ/kg, but still five times smaller than my home lettuce. Trade-offs between eating ‘local’ and energy and environmental impact are widespread—the energy cost of transporting food is (typically) small compared to the energy used in agriculture.
How about the greenhouse gas emissions? Conventionally grown lettuce involves fertilizers and land disturbance, leading to emissions of potent nitrous oxide and methane, so perhaps our lettuce will compare more favorably. We can use the U.S. average greenhouse gas intensity of electricity generation, around 0.5 kg CO2e/kWh [iii] to estimate our lettuce’s impact:
- Carbon intensity: 110 kWh/kg × 0.5 kg CO2e/kWh = 55 kg CO2e/kg lettuce
Estimating the lifecycle greenhouse gas impact of conventional lettuce once again is not trivial, but the literature points to a range of 1-3 kg CO2e/kg lettuce [iv], more than an order of magnitude less than our home-grown lettuce.
Is our lettuce cheaper than store-bought? Let’s compute the amortized cost of my lettuce using simple levelized cost calculations, which are a centerpiece of Energy Within Environmental Constraints.
- Variable cost (electricity) = 110 kWh/kg × $0.2/kWh = $22/kg lettuce, ignoring other variable costs like water, seeds, and nutrients.
- Fixed cost = CAPEX × CCF/output = $280 × 0.15/(0.02kg × 100 harvests/yr) = $20/kg.
The levelized cost of my lettuce then is at least $40/kg (counting electricity and capital only), much higher than store-bought lettuce at around $5-8/kg (the electricity input for my lettuce is higher by itself). Here’s a summary of the comparisons so far:
| Lettuce @ home | Field grown | |
|---|---|---|
| Energy intensity (MJ/kg) | 1000 | 10 |
| Climate forcing intensity (kgCO2e/kg) | 55 | 1-3 |
| Cost ($/kg) | 40 | 5-8 |
Another fun comparison is to compute the mass of fossil fuels needed to grow an equal mass of lettuce. It takes around 23 kg of fossil fuels for us to produce 1 kg of lettuce, plus some contributions from nuclear, hydro, wind and solar [v]. For every 20g serving of lettuce we harvest from our countertop, someone dug up and burned roughly 500g of the rotted remains of primeval swamp goo, turned the heat into electric power, and transmitted that power to us across the greatest engineering achievement of the 20th century, the modern electric grid.
Finally, just for fun, we can think about the overall energy efficiency. Lettuce is a food, and while we eat lettuce more for nutrients or pleasure than for calories, it’s still relevant to compare the energy used to make the lettuce with the energy content of the lettuce to derive an overall dimensionless energy efficiency. (Physicists and economists agree on the glory of dimensionless numbers.) The energy efficiency of the electricity-to-calories conversion can be evaluated as follows:
- lettuce is 0.13 kcal/g, so 20g x 0.13kcal/g/2.2 kWh = 0.15%;
- If we look at the efficiency of primary-energy-to-calories, then it’s a factor of 3 worse, 0.05%.
To be clear, this isn’t just a problem of lettuce. Converting primary energy into food takes energy. If I could only figure a way to plug myself in!
Jevons’ salad — implications for energy policy
White LEDs are amazingly efficient. When you compare luminaires (nerdy word for a complete electric light unit) with similarly acceptable color distribution, the luminous efficacy of commercial white LEDs can be 100 lm/W (lumens per watt), which is a factor of 7 better than typical incandescent bulbs.
When the Nobel committee awarded the Nobel Prize in physics to Shuji Nakamura for invention of the white LED, they suggested that the invention might dramatically decrease energy use for lighting: “With 20 percent of the world’s electricity used for lighting, it’s been calculated that optimal use of LED lighting could reduce this to 4 percent.”
N.B., the Nakamura breakthrough was a method of making gallium nitride (GaN) blue LEDs and solid state lasers with “blue-ray” disks as an early application. Most “white” LED’s use a blue LED source to stimulate a phosphorescent material that makes “white light”. Yet another important energy technology for which the big initial innovation was not driven by concerns about energy.
Michael Shellenberger and Ted Nordhaus of the Breakthrough Institute responded with a New York Times suggesting that the actual demand reduction might be much smaller than expected, saying “it would be a mistake to assume that LEDs will significantly reduce overall energy consumption.” They argue that, since the 1800s, as more efficient lighting technologies have been invented, demand “would rise for these new technologies and increase as new ways were found to use them [emphasis added]. This led to more overall energy consumption.”
This harkens back to the paradox of William Jevons, who in 1865 wrote about the possible exhaustion of English coal resources. Some scholars of the time argued that the ever-increasing efficiency of coal-burning technologies (e.g., Watts’s engine) would drive demand down, and prevent the country from ever running out. Jevons showed that efficiency and total coal use had increased together over time in England, implying that increasing efficiency may not be a good way to reduce energy demand, and may even increase it. Since then this topic has been hotly contested, with some pointing to the historical correlations and saying that energy efficiency may not be able to help us keep demand down, and others pointing to the growing, robust body of economics literature on “the rebound effect” that we’ll discuss shortly, which convincingly shows that when the efficiency of a technology is improved, people tend to use it more but not enough to erase all of the energy savings.
Gernot Wagner, then at EDF (now working with me, but that’s another story) worked with a group of environmental economists and energy experts who responded in a discussion on the New York Times’ website saying: “But what about the claim that this efficiency improvement will only lead to more energy use? This claim is simply not justified.”
What can we learn from my experience with LED’s at home? Can it illuminate the debate about Jevons’ Paradox?
First, I used LED’s to replace many of the incandescent bulbs in our apartment.
- I replaced 7 × 60W incandescent bulbs, which run for about 1 hr/day each for a total of 400 Wh/day; 7 × 8W LED bulbs for 1 hr/day is just 60 Wh/day.
- Savings: ~350 Wh/day or 130 kWhr/year which is 25$/year at a 0.2 $/kWhr power price.
Little of this saving is lost to rebound (definitions below). We don’t pay attention to the direct cost of leaving the lights on, but I do pay more attention to turning off our remaining incandescent bulbs than the LEDs, so there is some behavioral rebound.
But then I bought the LED garden and it uses 45W × 16 hrs = 720 Wh/day.
Of course, maybe the LED garden still represents energy savings. After all, if I had bought an old-fashioned incandescent Aerogarden it would have used 7 times as much power! So LEDs saved energy after all.
No. Incandescent are so inefficient, and they emit so much of their energy in the near-infrared, which plants don’t use, that if one used them with sufficient brightness to make plants grow as fast in this garden, they would overheat the plants and kill them. Think Aero-‘desiccator’ or Aero-‘oven’ not Aerogarden.
The Aerogarden and its competitors are a new class of product, a product that would not have existed without new high-efficiency lighting technologies. Thus, a technology that raised the technical efficiency of an energy conversion process also opened up a new source of energy demand.
 It’s not just my little indoor garden. There’s rapid growth in
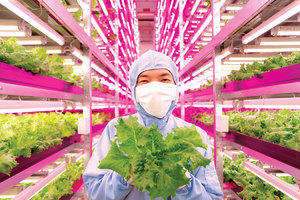
commercial farming using LED lighting to produce specialty vegetables for high-value markets. And this isn’t just a few little startups, Phillips is developing special LEDs for indoor farming. GE is doing the same and they have partnered with a company in Japan with multiple lettuce growing factories. The largest in Japan grows 10,000 lettuce heads/day. One white paper from this industry estimates that the market can grow to $15bn per year.
What’s driving this market? I don’t know, but I suspect it’s a desire by affluent consumers, possibly driven by high-end restaurants, and a desire to consume local produce. If so, then environmentally conscious locavores have created a monstrous blowback.
Now, let’s return to the feud over rebound. The environmental economists who pooh-pooh the idea that new high-efficiency technologies can increase energy demand focus on studies of three effects:
- The direct rebound effect — which occurs when an increase in efficiency lowers operating costs and, in turn, causes an increase in consumption. E.g., more efficient car -> lower cost per mile -> drive more
- The indirect rebound effect — due to the energy impacts of spending the money saved by the efficiency improvement. E.g., more efficient car -> more money at end of month -> more spending on books (low energy impact) or cheap vacations (high impact).
- The macro economic rebound, which itself comes in two forms:
- the macroeconomic price effect; e.g., more efficient cars -> lower gasoline consumption -> lower gasoline prices -> increased consumption of gasoline elsewhere in the economy;
- the macroeconomic growth effect; e.g. more efficient cars -> same technology invented to make cars more efficient is used elsewhere in the economy -> increased productivity leads to economic growth.
The environmental economists are very likely right that the first three rebound effects are typically large enough to cause a modest increase in energy demand in response to an efficiency improvement. Studies put the sum of all these three rebound effects at, say 10-40% in developed countries (see this recent review of the issue by Gernot and colleagues). This is important, and makes the energy reductions from energy efficiency improvements significantly less than one might expect, but it’s not ‘backfire,’ which would require rebound >100%.
But notice that my LED garden — or its commercial cousins — is not covered by any of the economist’s rebound effects except (arguably) the last one, the macroeconomic growth effect.
New high-efficiency technologies, which may reduce demand (albeit with some rebound) in one class of applications (replacing incandescent lights in my living room with LED lights), end up creating new categories of products that would not otherwise have existed (the Aerogarden). The compact size of LEDs, their low heat production, and low variable cost all can open up new uses not imagined before, from machine vision to always-on displays and signage, to more extensive outdoor and street lighting, and more.
This is the root of the concern that Shellenberger and Nordhaus were raising. The specific arguments and numbers given by Wagner et al are accurate but they don’t address the case that worries me here.

It’s important to note that efficiency improvements, and their unintended consequences we explored here, enable huge gains in human welfare. They don’t just enable my family’s expensive lettuce – they also are bringing solar-powered lighting to the world’s poorest, allowing a new generation a chance to study at night for a better life. (N.B., A colleague in Calgary was an early pioneered with Light Up The World, and now there are amazing commercial ventures like http://www.m-kopa.com/).
It’s sometimes said that efficiency is a good thing “even with” rebound, but if your goal is to increase human welfare then rebound itself is a good thing – if rebound is happening, people are consuming more of the things they like, and the economy is growing.
But if your goal is to use targeted efforts to increase energy efficiency as a means to cut absolute energy use and carbon emissions then this is larger induced technology “rebound” should give you pause.
I share Shellenberger and Nordhaus’s skepticism that improvements in energy efficiency will automatically lead to predictable reductions in energy demand. This matters for policy. It implies that if we want to manage carbon emissions, it’s risky to rely on demand reduction from energy efficiency as part of this effort, because demand can rise in unpredictable ways and efficiency improvements can be part of the rise. It implies that the safest way to manage carbon emissions is to decarbonize the energy supply, so we guarantee a stable climate no matter what happens with energy demand, innovation, and the continued flourishing of new ways to use energy to improve human welfare.
N.B. Our edX course is deliberately opinionated — but when my views depart from the mainstream we work to bring in other voices. Here’s a clip of energy efficiency guru Amory Lovins responding to my question about efficiency and demand.
Addendum
I mentioned before that Gernot Wagner has since left EDF and joined me at Harvard, largely in an effort to work on solar geoengineering. But that doesn’t mean we can’t have some fun with rebound, too. A few words in response to the above by Gernot:
First off, yes, the Nobel committee goofed by citing that calculation. It ignored the rebound effect. Plain and simple. Shellenberger and Nordhaus were right to point that out.
That’s a broader phenomenon: physicists and engineers — present company excluded — tend to ignore these important behavioral effects. The same goes for some environmentalists with a clear agenda of talking up their favored approach. (EDF excluded on that one, which has long argued for the most economically sensible solution and (mostly) gets it right on rebound, too. Full disclosure: I still work for EDF on a consulting basis.)
That said, my first entry into this long-standing debate was a Nature arguing how “The rebound effect is overplayed.” I stand by these words, chiefly for the same reason David mentions above: Don’t focus on rebound. Trying to minimize it is the wrong target. Maximize welfare instead. David gets jollies out of his Aerogarden, as he should. I’ve seen and admired it. It’s a cool gadget.
David is also right, of course, that his Aerogarden fits squarely into the final rebound category: the macroeconomic growth effect. That's also the category about which we know the least, largely because economists have a poor handle of why growth happens. That's why we economists insist on a causal link. No causal link, no rebound. The Aerogarden might be closer to having such a direct link than many other examples.
Either way, back to the main conclusion: Don't focus on rebound. Focus on welfare.
In the end, all of this is what makes Energy Within Environmental Constraints such an important course. It combines the fundamental physics and engineering with economics and policy.
References
Bin, Shui, and Hadi Dowlatabadi. "Consumer lifestyle approach to US energy use and the related CO 2 emissions." Energy policy 33, no. 2 (2005): 197-208.
Brander, M., A. Sood, C. Wylie, A. Haughton, and J. Lovell. "Electricity-specific emission factors for grid electricity. Ecometrica." Edinburgh, United Kingdom (2011).
Carlsson-Kanyama, Annika, Marianne Pipping Ekström, and Helena Shanahan. "Food and life cycle energy inputs: consequences of diet and ways to increase efficiency." Ecological economics 44, no. 2 (2003): 293-307.
Carlsson-Kanyama, Annika, and Mireille Faist. Energy use in the food sector: a data survey. Stockholm, Sweden: Swedish Environmental Protection Agency, 2000.
Gillingham, Kenneth, David Rapson, and Gernot Wagner. "The rebound effect and energy efficiency policy." Review of Environmental Economics and Policy (2016).
Pelletier, Nathan, Eric Audsley, Sonja Brodt, Tara Garnett, Patrik Henriksson, Alissa Kendall, Klaas Jan Kramer, David Murphy, Thomas Nemecek, and Max Troell. "Energy intensity of agriculture and food systems." (2011).
Stoessel, Franziska, Ronnie Juraske, Stephan Pfister, and Stefanie Hellweg. "Life cycle inventory and carbon and water FoodPrint of fruits and vegetables: Application to a Swiss retailer." Environmental science & technology 46, no. 6 (2012): 3253-3262.
Weber, Christopher L., and H. Scott Matthews. "Food-miles and the relative climate impacts of food choices in the United States." Environmental science & technology 42, no. 10 (2008): 3508-3513.
WWF, How Low Can We Go?: An Assessment of Greenhouse Emissions from the UK Food System and the Scope for Reduction by 2050 (2010).
Endnotes
[i] LLNL says that, in 2015, 4*10^10 GJ of primary energy flowed into the electricity sector, and 3.7*10^9 MWh of electricity flowed out (for almost exactly 33% efficiency)
[ii] Carlsson-Kanyama (2003) finds 5 MJ/kg for cabbage -> 1.4 kWh/kg. Bin (2003) finds 4.4 kWh/kg for vegetables [see table 2, EIO-LCA coefficients]. Carlsson-Kanyama (2000) finds 1 kWh/kg for lettuce for open field, 45 kWh/kg for greenhouse, including production, storage, transportation. Pelletier (2011) Finds 1.4 kWh/kg for vegetables.
[iii] U.S. EPA says 2.05*10^12 kg of CO2e from electricity generation in U.S. in 2014, EIA says 4.1*10^12 kWh generated in 2014, for 0.5 kg CO2e/kWh.
[iv] Stoessel (2012) finds 3 kg CO2e/kg for lettuce in LCA in Switzerland, growing in heated greenhouse increases by factor of 5 to 10. Weber (2008) finds ~2 kg CO2e/kg for fruits and vegetables in LCA in US [see their fig 2], supplement table SI-3 indicates half of impact from N2O, 5% from CH4, rest from CO2. WWF (2010) finds ~1 kg CO2e/kg for lettuce produced in the UK, but that only goes up to regional distribution center and doesn’t count distribution to grocery stores, energy for consumers to go buy it, etc. Central estimate -> ~2 kg CO2e/kg for open field lettuce, 10-20kg CO2e/kg lettuce for heated greenhouse.
[v] 330 kWh =1.2GJ of primary energy for 1 kg of lettuce; LLNL says 38% of US electricity from coal, 26% from gas; we assume the following energy densities: 0.027 GJ/kg for coal, 0.052 GJ/kg for gas. The mass of coal needed = 1.2GJ*0.38/.027GJ/kg = 17 kg; The mass of natural gas needed = 1.2GJ*.26/.052 = 6 kg. 23 kg of coal and gas needed for 1 kg of lettuce; for every 20g serving 460g of fossil fuels needed (~500).